Density Plot
What is a Density Plot?
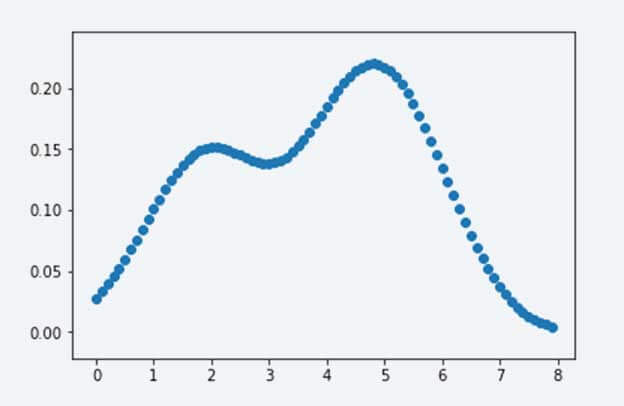
A density plot is a representation of the distribution of a numeric variable. Also called Kernel density plot, it organizes the data on a continuous interval or time period. Its main use is as a tool to understand the central characteristics of the data under study, such as distribution shape, median, number of peaks, etc.

Figure 1: a typical density plot.
The most common way to create density plots is through the kernel density estimation technique. This method consists of drawing a continuous curve – called the kernel – at every individual data point, and then, creating a single continuous curve by adding them up. The most used kernel smoother is the Gaussian kernel. Other kernel smoothers are the nearest neighbor and local linear regression.
Why are Density Plots Important?
Density plots are a smoothed version of a histogram. Through the kernel function, they provide a version of it with reduced noise and that is not affected by the number of bins. As such, they deliver a better representation of a distribution’s shape.
Density plots are used as a tool in preliminary data analysis: their peaks indicate where the data is concentrated, their shapes show how close or far the data is from a Normal or other well-known distribution functions, and more. Essentially, they are a good summary of the data under study.
Density Plots + LogicPlum
Density plots demand statistical knowledge from users: from the selection of the kernel function to the computation and plotting of its values. This statistical and computational knowledge is contained in LogicPlum’s platform and used through automation. These features provide its users with the ability to create efficient models and concentrate on their interpretation, aware of the fact that they are using the top techniques available.
Guide to Further Reading
For those interested in creating density plots with Python:
Koehrsen, W. (2018). Histograms and Density Plots in Python. Available at https://towardsdatascience.com/histograms-and-density-plots-in-python-f6bda88f5ac0


