What is the Spearman’s Rank Correlation Coefficient?
In statistics, the Spearman’s rank correlation coefficient is a nonparametric measure of the statistical dependence between the rankings of two variables. Named after its creator Charles Spearman and denoted by the Greek letter ρ or as rs, it evaluates the relationship between two variables using a monotonic function (a function between ordered sets that preserves or reverses the order).
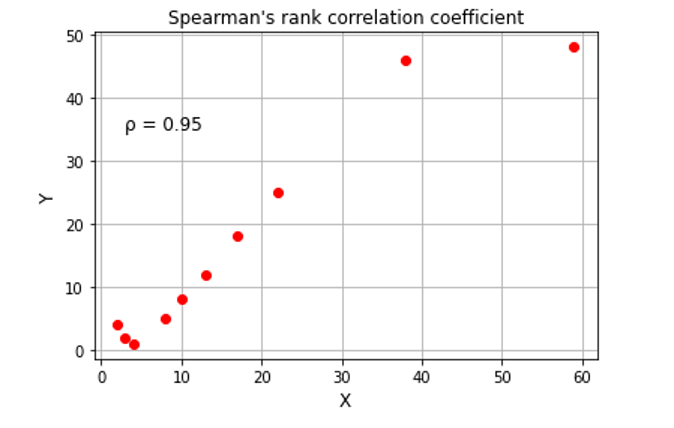
The Spearman correlation rank takes values between -1 and 1. A perfect correlation is given when the value obtained is either 1 or -1, indicating that each of the two variables considered is a perfect monotone function of the other.

Figure 1: Spearman’s rank correlation coefficient.
Mathematically, for a sample of size n, it is calculated as follows:

Where
rgX and rgY are the converted ranks of X and Y, ρ is the Pearson correlation coefficient, cov denotes the covariance, and σ the standard deviation.
When all n ranks are distinct integers, the equation becomes:

where di = rg(Xi) – rg(Yi).
Why is the Spearman’s Rank Correlation Coefficient Important?
The Spearman’s rank correlation coefficient is widely used to determine the strength of the relationship between two datasets. Its applications range from economics to physics to psychology and more. It is used in field research studies to validate empirical relationships. However, it must be noted that a strong relationship doesn’t imply a cause-effect relationship, but merely that the two variables show related patterns.
Spearman’s Rank Correlation + LogicPlum
Understanding the relationship between different factors requires two types of knowledge. First, statistical knowledge is necessary to use formal methods. Second, the science behind the factors involved, necessary to create a realistic interpretation of the results.
LogicPlum’s platform has been designed to help in the creation of models for those lacking the necessary mathematical and statistical knowledge. It includes cutting-edge methods from artificial intelligence, machine learning, statistics, mathematics; which are processed in an automated manner. Thus, users can concentrate on the second step, which is, using their knowledge to interpret the results.
Guide to Further Reading
For those wanting to use Python, pandas offers the corr function. The online guide is available at https://pandas.pydata.org/pandas-docs/stable/reference/api/pandas.DataFrame.corr.html
For those who prefer the Julia language: https://juliastats.org/StatsBase.jl/stable/ranking/
For R practitioners: https://www.rdocumentation.org/packages/stats/versions/3.6.2/topics/cor


