What is Test Statistic?
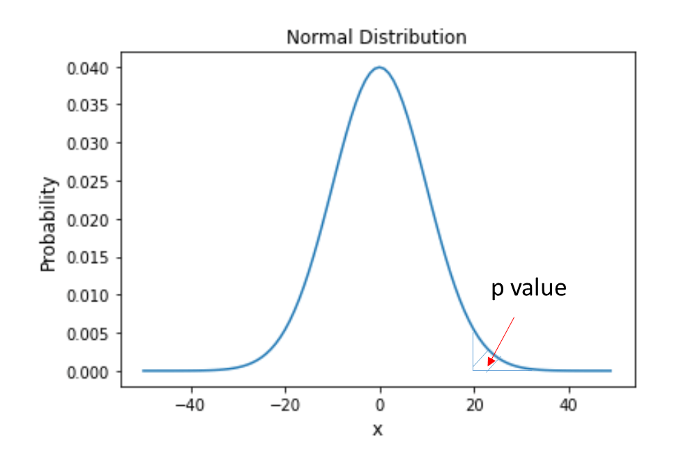
A test statistic is a statistic used in hypothesis testing. A test statistic is defined in a way that from the observed data it can quantify the support or rejection of the null hypothesis. An important property of a test statistic is that the sampling distribution under the null hypothesis must be known and calculable, as this is a necessary condition to calculate the p-value of the results. This p-value represents the agreement between the calculated test statistic and the predicted value.

Figure: A p-value is an area that defines the likelihood of a result happening by chance.
There are different statistical tests. The table below summarizes the most common ones.
| Test statistic | Null and alternative hypothesis | Hypothesis test |
| t-value | H0: The means of two groups are equal.
H1: The means of two groups are different. |
T-test |
| z-value | H0: The means of two groups are equal.
H1: The means of two groups are different. |
Z-test |
| F-value | H0: The means are equal.
H1: The means are not equal. |
ANOVA |
| Χ2-value | H0: The two samples are independent.
H1: The two samples are not independent. |
Chi-squared test |
Why are Test Statistics Important?
Test statistics play a key role in research and engineering, as they help prove whether the results of a study are due to chance or not. Technically, the difficulty lies in selecting the right statistical test.
The applications are many. From political surveys to medical studies to product quality control, statistical tests are key to ensure the validity of the results. In politics, they provide reliability to studies done from population samples. In medical studies, they help ensure that medications are effective. And in production, they help maintain quality standards.
Tests statistics + LogicPlum
Using test statistics requires an understanding of the probability distribution that describes the data under study. They also require knowledge about the different hypothesis tests. However, many times industries and researchers lack the necessary mathematical and statistical background.
LogicPlum is the ideal tool for them, as it performs all operations in an automated manner, permitting them to test hundreds of different potential solutions, and selecting the most efficient one for the problem under study. As a result, economists, financial analysts, industries, and laboratories can concentrate on interpreting the model’s results, knowing that the most advanced mathematical techniques have been correctly employed.
Guide to Further Reading
A nice guide to statistical tests in Python:
Brownlee, J. 17 Statistical Hypothesis Tests in Python (Cheat Sheet). https://machinelearningmastery.com/statistical-hypothesis-tests-in-python-cheat-sheet/


